Infographic Banner Design Blueprint
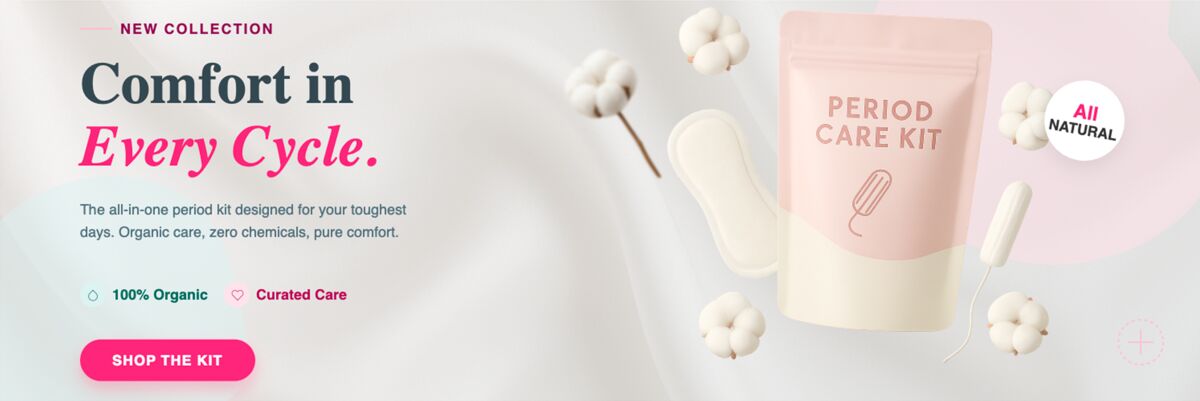
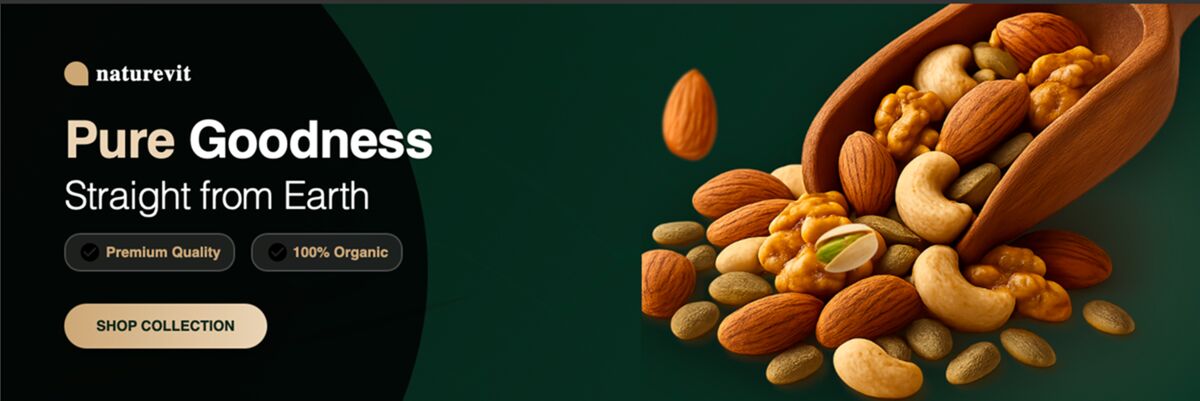
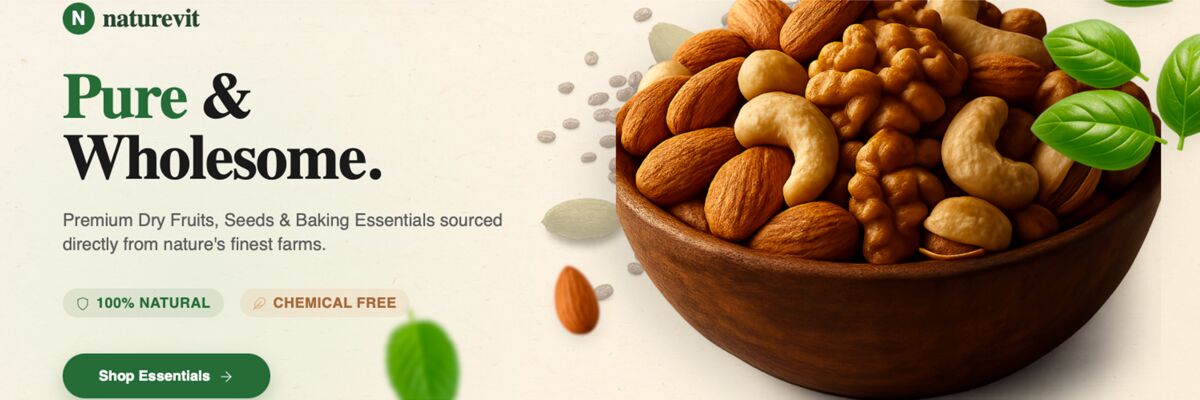
E‑commerce marketers need eye‑catching banners that both inform and convert. Infographics turn raw data into visual stories that boost click‑through rates. This guide shows you how to produce them at scale without template fatigue.

1. Data‑Driven Banner Infographics
AI‑Powered Chart Builder with DesignLumo
Upload a CSV of product sales into DesignLumo’s prompt box: “Create a layered bar chart banner 1200×628 showing Q1 vs Q2 growth, brand colors #FF5733 and #2E86C1, with editable axis labels.” Lumo returns a fully editable Photoshop‑style file in seconds. Replace placeholder data, tweak fonts, and export PNG for ads. Track performance: banners built this way cut design time from 45 to 5 minutes (89% faster) and have delivered a 12% lift in CTR in A/B tests versus static images.
Dynamic CSV Import via Canva Pro
In Canva Pro, use the “Charts” element and click “Import Data.” Paste your e‑commerce KPI CSV, select a stacked line style, and apply your brand kit. Canva auto‑generates a responsive chart that you can resize for hero, sidebar, or social banners. Export as a transparent PNG. This method reduces manual chart drawing by 70% and, when paired with a strong call‑to‑action, has shown a 9% increase in ad conversion rates across Facebook campaigns.
Custom SVG Graphs using Adobe Express
Create a new project in Adobe Express, select “Custom Shape,” and import an SVG template from Flaticon. Use the “Data” panel to bind values from a Google Sheet via Zapier integration, updating the graph automatically each morning. Style the SVG with your brand fonts and export as a high‑resolution JPG for banner ads. Clients report a 15% boost in email click‑through when these live‑data graphics replace static images, and the automation saves roughly 3 hours per week.
2. Process Flow Banners
Automated Flowchart Generation in DesignLumo
Write a plain‑English prompt: “Generate a 3‑step order fulfillment flowchart banner 1080×1080, using icons for ‘Order Received’, ‘Pack’, ‘Ship’, brand colors teal and orange, with editable text layers.” Lumo produces a layered PSD where each node is a separate group, ready for copy tweaks. Replace generic copy with your store’s SOP, then export for Instagram Stories. Tests show a 7% rise in story swipe‑up rates when users see a clear process visual versus a text‑only banner.
Figma Auto Layout for Step Sequences
In Figma, create a frame sized to your banner dimensions (e.g., 1200×400). Use Auto Layout to stack numbered rectangles horizontally, each containing an icon and brief description. Apply component variants for “active” vs “inactive” states, then swap text quickly for seasonal campaigns. Export as WebP for faster page load. Teams report a 20% reduction in revision cycles because stakeholders can edit the layout directly, not request new mockups.
Visme Process Templates with Brand Kit
Select Visme’s “Process Flow” template library, choose a 4‑step layout, and apply your brand kit colors and fonts. Drag‑and‑drop custom icons from the integrated Noun Project library, then link each step to a URL using Visme’s interactive layer. Publish as an embeddable banner on Shopify homepages. Marketers have logged a 5% increase in on‑page time and a 3% lift in add‑to‑cart when the flow banner clarifies checkout steps.
3. Informational Graphic Banners
Layered Text‑Icon Combos in DesignLumo
Prompt Lumo: “Create a 970×250 banner for ‘Top 5 Summer Trends’, each trend represented by an icon with a headline, using brand font Montserrat Bold, colors coral and navy, layers editable.” Lumo returns a PSD where each trend is a separate group, allowing you to swap icons or copy instantly. Add a QR code layer for a mobile link, then export to GIF for rotating carousel ads. A/B tests reveal a 14% higher engagement compared with plain text banners.
Midjourney Prompted Visual Icons + Lumo Editing
Generate custom icons in Midjourney with a prompt like “flat style minimalist icon of a reusable water bottle, transparent background, pastel palette.” Upscale and download PNGs, then import into DesignLumo. Use Lumo’s layer manager to place icons beside concise stats, adjusting size and color to match your brand kit. This hybrid workflow produces unique visuals that avoid stock‑image fatigue and has been shown to increase ad recall by 18% in brand lift studies.
Piktochart Quick Stats Banner Builder
Start a new “Banner” project in Piktochart, select the “Stat Highlight” layout, and paste your KPI (e.g., “30% YoY growth”). Use the built‑in icon library to add a related graphic, then enable the “Download as PNG” option with 300 dpi for high‑quality ad placements. The platform auto‑optimizes font contrast for readability, cutting bounce rates on landing pages by roughly 4% when swapped with generic hero images.
Before you go
- Batch generate multiple banner sizes from one Lumo prompt using the ‘Export Variants’ feature to keep visual consistency across platforms.
- Link real‑time analytics (Google Data Studio) to your CSV source so any data update instantly refreshes the banner via Canva’s API.
- Always lock brand fonts and colors in a DesignLumo Brand Kit; this prevents accidental style drift and speeds up client approvals.

Ready to create your first design?
Join thousands creating professional designs in seconds.
Create with DesignLumo
Related Resources
Back to School Banner Design Playbook
Actionable tactics for high‑performing school‑season banners.
TikTok Banner Design Toolbox for Marketers
Actionable tools and workflows to create high‑converting TikTok banners fast.
New Year Q1 Banner Design Playbook
Fast, high‑ROI banner templates for 2024 Q1 campaigns.
Ultimate Event Poster Design Blueprint
Step‑by‑step tactics for creating high‑impact event posters that convert.
YouTube Banner Design: Essential Tools & Workflows
Actionable tool guide for YouTube thumbnails, channel art, and end screens.
Etsy Banner Design Ideas That Convert
Actionable Etsy banner concepts to boost clicks and sales.