A/B Testing Ad Visuals: What Actually Moves the Needle for LinkedIn Marketing Agencies
Learn which LinkedIn carousel visual elements truly impact engagement and leads, and get a practical framework for weekly planning, metric tracking, and scaling wins across multiple executive profiles.
Agency teams spend hours crafting text‑heavy carousels, then hope the design resonates. Without data, you’re betting on aesthetics instead of actual performance.

The Real Problem: Visual Guesswork in LinkedIn Carousels
“A/B testing isn’t a luxury; it’s the only way to separate clever copy from visual that converts.”
Core Visual Variables Worth Testing
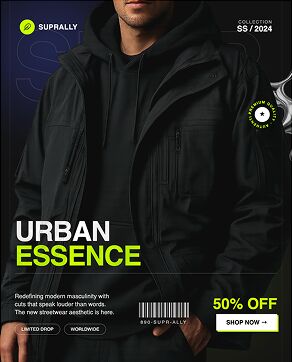
- Color palette – bold brand colors vs. muted neutrals
- Typography hierarchy – large headlines vs. subtle subheads
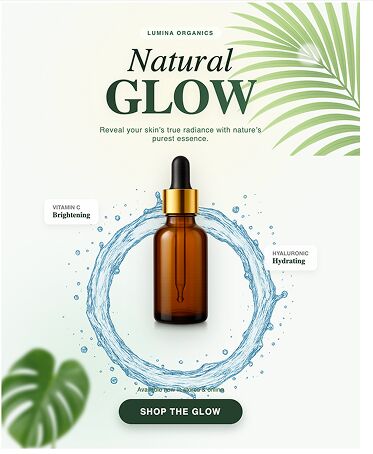
- Layout density – full‑bleed images vs. white‑space‑heavy frames
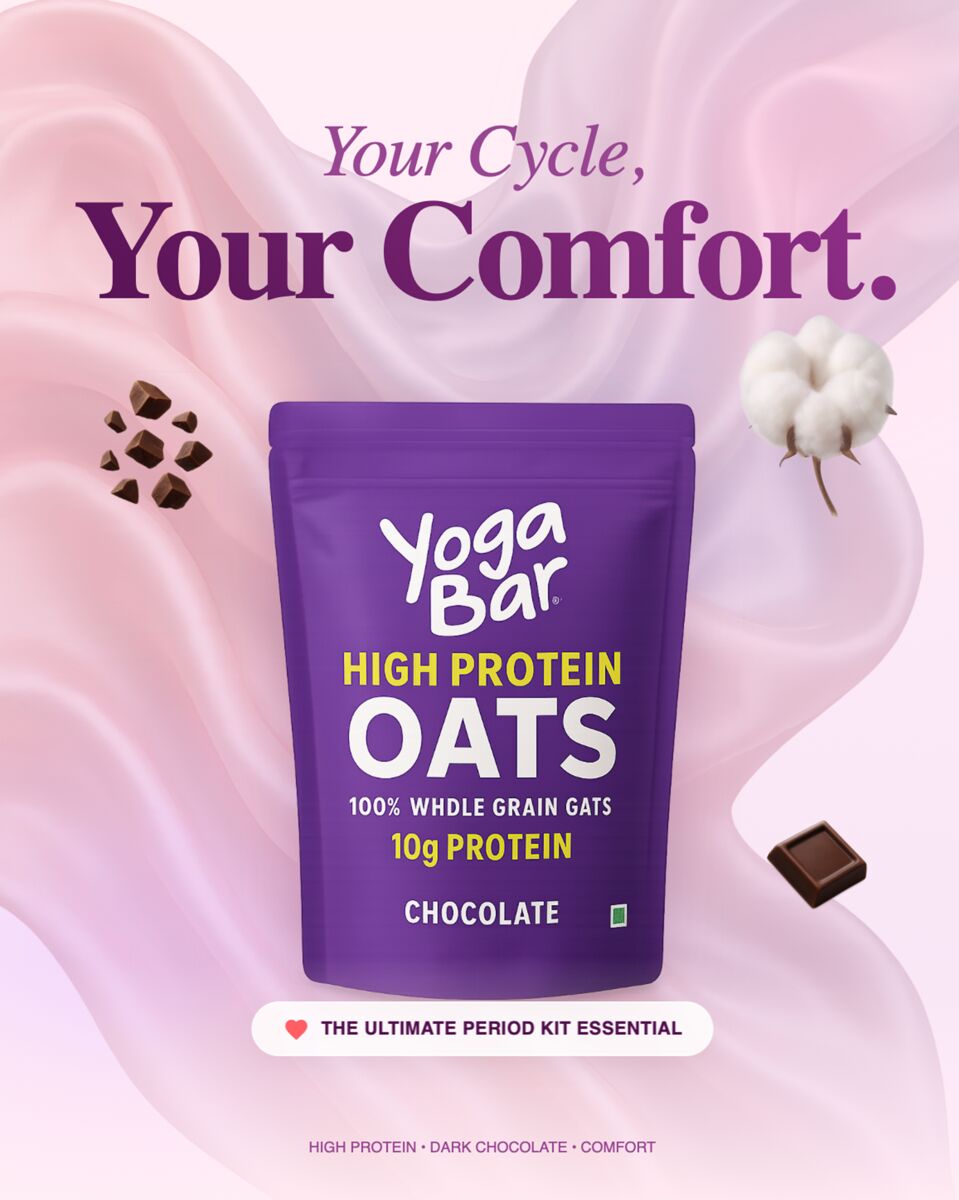
- Imagery style – data‑driven charts vs. human‑focused photos
- CTA button design – solid fill vs. outline, placement at slide 1 or 3
These elements directly affect scroll‑through rates, click‑throughs, and downstream lead quality. Pick two to three per test to keep results interpretable.
Building a Testable Carousel: From Idea to Editable Draft
Start with a single slide concept in Canva or Figma, then clone it for each variant. When you need fresh ideas at speed, generate base frames with AI Social Media Posts and edit them directly.
- Define the visual variable and create two distinct versions.
- Export each version as a PDF or PNG for LinkedIn’s carousel upload.
- Tag each version in Shield Analytics with a unique UTM parameter.
- Schedule both variants to run simultaneously for the same audience size.
Structuring Your A/B Test for Reliable Data
A/B tests only inform decisions when they’re statistically sound. Use Shield’s built‑in significance calculator or a free online tool.
- Minimum sample: 1,000 unique impressions per variant.
- Test window: 5–7 days to capture weekday and weekend behavior.
- Primary KPI: carousel click‑through rate (CTR). Secondary KPI: lead form conversions tracked in AuthoredUp.
Interpreting Results: From Clicks to Leads
Look beyond raw CTR. A higher click rate that doesn’t translate into qualified leads may indicate a misleading visual hook.
“The winning visual is the one that moves the needle on both engagement and pipeline, not just vanity metrics.”
Scaling Wins Across Multiple Executive Profiles
When a visual pattern proves profitable for one founder, replicate it across other thought leaders while respecting each personal brand.
- Create a shared Brand Kit in DesignLumo so colors and fonts stay consistent.
- Save the winning layout as a master template for rapid duplication.
- Automate UTM generation with Taplio to keep tracking clean.
Quick Action Checklist
- Pick 2–3 visual variables to test this week.
- Build both variants in your design tool, then export.
- Add unique UTMs and launch simultaneously on LinkedIn.
- Monitor CTR and lead conversions in Shield and AuthoredUp.
- Document the winner and update your master template library.
Topics covered
Create with DesignLumo




Ready to create your first design?
Join thousands creating professional designs in seconds.
Related articles
Social Proof Graphics That Build Trust and Drive Conversions
Learn how LinkedIn marketing agencies can create high‑impact testimonial carousels, review graphics, and case‑study visuals that boost trust and conversion rates.
Productized Creative Services: Packages That Sell Themselves for LinkedIn Agencies
Turn carousel design, ghostwriting, and branding into repeatable packages that sell themselves. A roadmap for LinkedIn marketing agencies.
AI Design Tools Compared: Which One Is Right for Your LinkedIn Marketing Agency
Compare Canva, Adobe Express, DesignLumo, and Midjourney for B2B LinkedIn agencies. Find the tool that scales carousel creation and executive branding.